The new Market Models Review is released on 12. January 2020. 9 of 10 Market Models are positive. Clearly, we are in a bull market.
In our Market Models Review you can find more details:
When to Trade?
The 10 Market Models are optimal for timing the stock market. The big picture results from the numerous single pieces of data. This so-called multivariate approach is the best way to know when to trade stocks long.
But how it works in the past?
All single models are tested in the past. For instance model 5: the Bullish Percent Index has a long tradition. You find information about this Market Model and all about point & figure charting in this great book:
Or Market Model 10 based on relative strength. Here is a really good book full of backtests:
In stockcharts.com you find an introduction of Market Indicators. For instance, about the Advanced-Decline-Line – Market Model Number 8, the Bullish Percent Index – Market Modell Number 5 and the Percent above Moving Average (Market Model Number 2). Look at the American Association of Individual Investors for the weekly sentiment survey. There are also historical data and more articles.
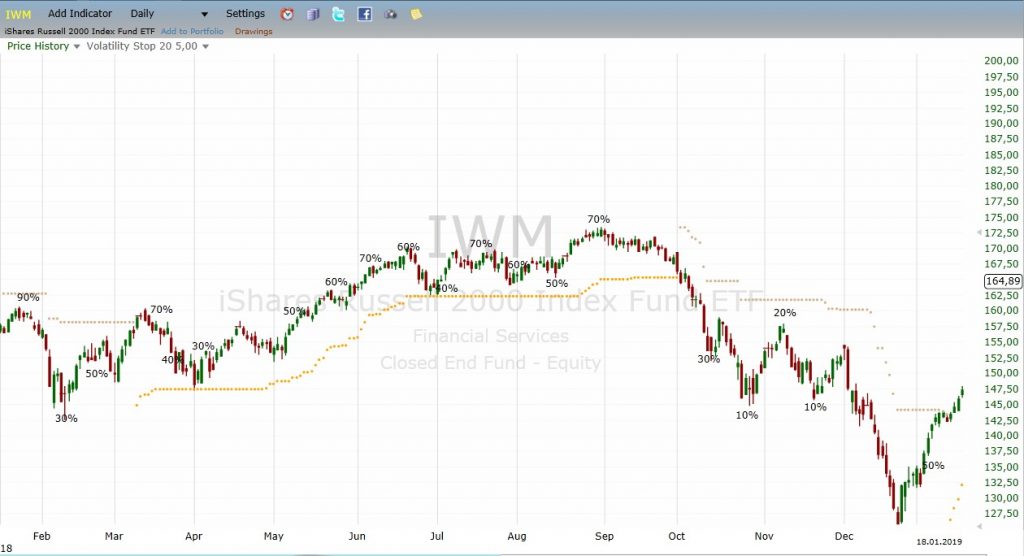
2017 was easy. All the time the Market Models showed a bullish market. 2018 the Market Models worked fine as well. We got at the right time bearish signals for the correction from October to December. You see in the next graphic of the Russel 2000 ETF when how much percent of the Market Models were bullish:
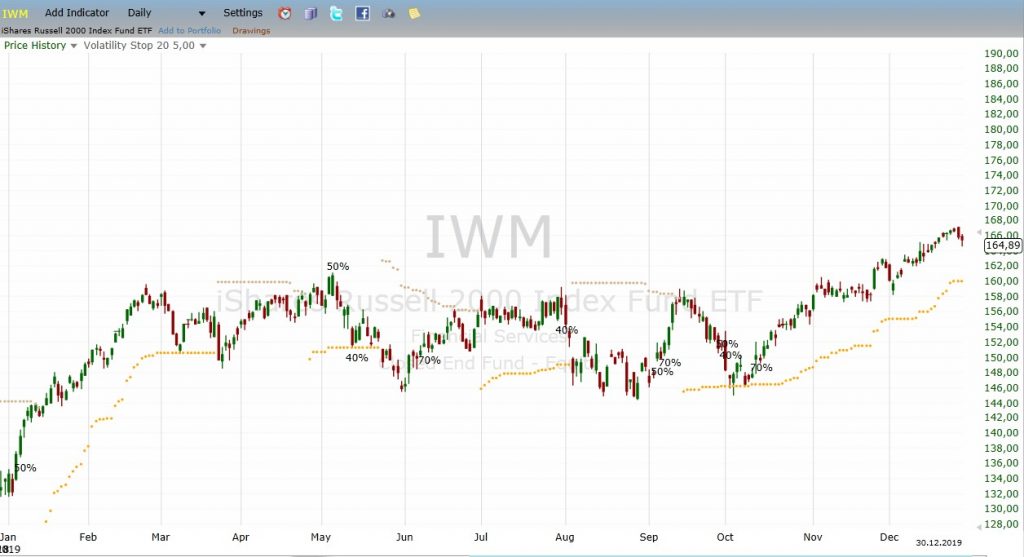
In 2019 the Market Models changed from time to time from March to October in a sideway market. But in the beginning and in the end of 2019 our models showed clearly a bull market:
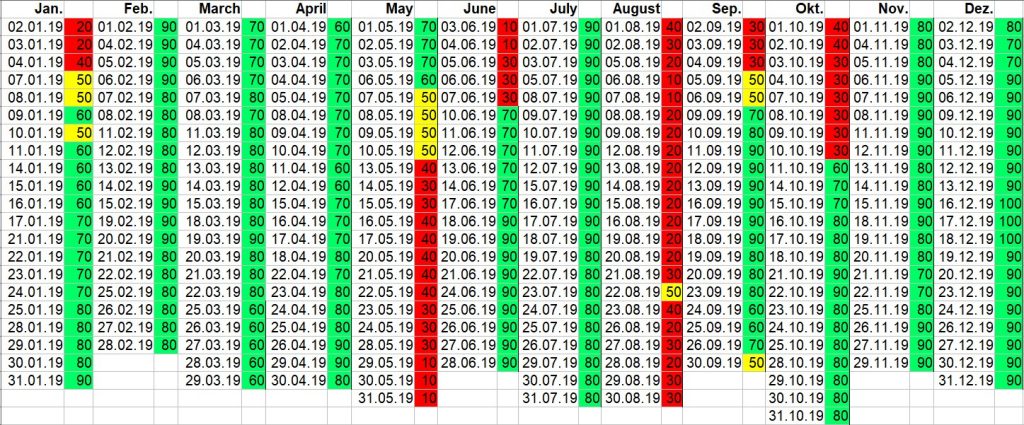
The daily signals in detail:
You can test our weekly Market Models Review. Please click here.


